MACCS: Magnetometer Array for Cusp and Cleft Studies
W.J. Hughes 1 and M.J. Engebretson 2
1 Center for Space Physics, Boston University
Boston, Massachusetts 02215, U.S.A.
2 Department of Physics, Augsburg College
Minneapolis, Minnesota 55454, U.S.A.
ABSTRACT -- The Magnetometer Array for Cusp and Cleft Studies (MACCS) is a high latitude array of 8 high time resolution magnetometers supplemented with high time resolution data from 4 standard observatories in northeastern Canada. The array was installed between August 1992 and August 1995 and is run cooperatively by Boston University and Augsburg College with assistance from the Geological Survey of Canada and the University of Alberta. Data is collected at either 1 or 2 samples per second at a sensitivity sufficient to observe Pc 1-2 pulsations. MACCS can be used to study high latitude ionospheric convection currents, substorm currents, and ULF waves. Data requests may be submitted to either hughes@bu.edu or engebret@augsburg.edu. The MACCS World Wide Web site is http://space.augsburg.edu/maccs/.
1. Introduction
The Magnetometer Array for Cusp
and Cleft Studies (MACCS) is the first closely spaced two dimensional array
to be deployed at cusp and cleft latitudes. The array consists of eight flux
gate magnetometers in Canada's Northwest Territories at 75 o --80 o magnetic
latitude.
High time resolution data is also collected at four neighboring Standard Canadian
Magnetic Observatories as part of the MACCS project. The array is run cooperatively
by Boston University and Augsburg College with assistance from the Geological
Survey of Canada and the University of Alberta, and is funded as part of the
GEM (Geospace Environment Modeling) program of NSF. As its name suggests, the
primary purpose of MACCS is to study processes at the magnetospheric cusp and
cleft. The ring core flux gate magnetometers have a noise level of 0.01 nT and
data is recorded at either 0.5 sec resolution (MACCS sites) or every 1 sec (observatories),
allowing the study of variations ranging in frequency from dc up to waves in
the Pc 1 band.
2. Location
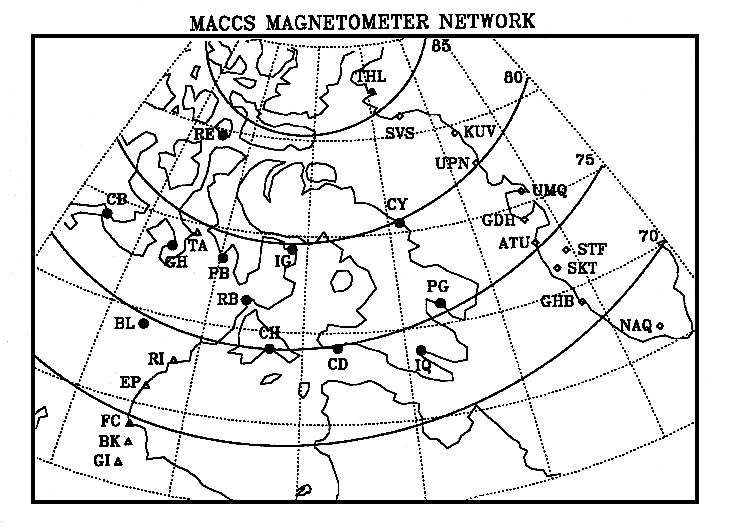
Figure 1 is a map of northeastern Canada showing the location of MACCS. The solid lines show PACE corrected magnetic latitude [Baker and Wing,1989]. Station coordinates are given in Table 1. The MACCS sites (together with the four Canadian observatories, Iqaluit, Baker Lake, Cambridge Bay and Resolute) can be pictured as forming two east-west chains. The southern chain, at about 75 o magnetic latitude, consists of 5 stations extending from Pangnirtung to Baker Lake and covers 4 hours in MLT. The northern chain, at about 80 o magnetic latitude, consists of 6 stations extending from Clyde to Cambridge Bay and covers 5 hours in MLT. The most northern station, Resolute, is almost always within the polar cap, and is the proposed site for the US Polar Cap Observatory.
Figure 1 also shows how MACCS fills the space between the CANOPUS and Greenland magnetometer arrays. The six CANOPUS sites which lie within the area covered by Figure 1 are marked as open triangles. These magnetometers form a latitudinal chain that links MACCS to lower auroral latitudes. The Greenland west coast magnetometer chain, shown as diamonds, forms another latitudinal chain to the east of MACCS. In addition to these flux gate magnetometers, search coil magnetometers are operated at Iqaluit (IQ) and Sondrestromfjord (STF) by Roger Arnoldy of the University of New Hampshire. The latitudinal chain in Alaska and western Canada managed by John Olson of the University of Alaska is off the map to the west. Taken together this collection of magnetometer arrays and observatories in North America and Greenland represents the most comprehensive semiglobal coverage of the auroral zone and polar cap to date. From them we will be able to calculate detailed instantaneous ionospheric current patterns and hence convection patterns. MACCS also complements other measurements, in particular the SuperDARN HF radars and optical instrumentation in northern Canada, to provide a comprehensive suite of information needed to help understand how boundary processes of various kinds map to ionospheric altitudes.
3. Operations
The original four MACCS magnetometers were installed in August 1992 and the remaining four a year later. The full array of 12 high time resolution magnetometers came in operation in August 1995 with the installation of a data logger at Iqaluit Observatory. The start date of a quality data stream from each site is listed in Table 1. Occasional data gaps occur at individual stations due to various equipment problems. All the MACCS sites are within Inuit settlements in the Canadian Northwest Territories which are served by scheduled air service, in some cases daily and in all cases at least 3 times a week. Augsburg College and Boston University split the primary responsibilty for the eight MACCS sites. Boston University installed and maintains the four eastern sites (Pangnirtung, Cape Dorset, Clyde River and Igloolik) while Augsburg takes responsibility for the western four sites.
Each site is equiped with a Narod ringcore flux gate magnetometer, designed and supplied by Dr. B. Barry Narod of Narod Geophysics, Ltd., Vancouver, B.C., Canada. These instruments are modeled after the MAGSAT magnetometer and are also used in the CANOPUS observatories and in the recent upgrading of both the Canadian and USGS standard observatories. The MACCS magnetometers produce digital samples at a rate of 8 per second, filtered to 2 Hz using a 3 pole Butterworth filter (frequencies at 4 Hz are reduced by 12 db). The internal magnetometer clock is synchronized with UT using the signal provided by a Kinemetrics OMEGA band receiver board, which is integrated into the electronics module for each observatory site. Timing is accurate to 1 ms providing the OMEGA signal is not lost for more than 24 hours (which rarely occurs).
The data are recorded using a ruggedized 386 PC computer with an Irwin Accutrak 120-MB cartridge tape drive. The 8 samples per second are averaged and recorded at a rate of two samples per second. Although earlier fluxgate sensors had low signal to noise ratios at such rates, the high sensitivity of the Narod ring core magnetometers (a noise level of 0.01 nT) makes them adequate for the detection of shorter period (Pc 1 and 2) pulsations as well as for longer period variations. At this sampling rate, each station generates about 3 megabytes per day, or 90 MB/month (uncompressed). Data cartridges are mailed monthly from each station to Boston and Minneapolis. Each data logging system is also equipped with a 2400 baud modem and telephone line so that instrument performance can be checked remotely and limited programming of the instrument, such as changing data rate, can be carried out without travelling to the site.
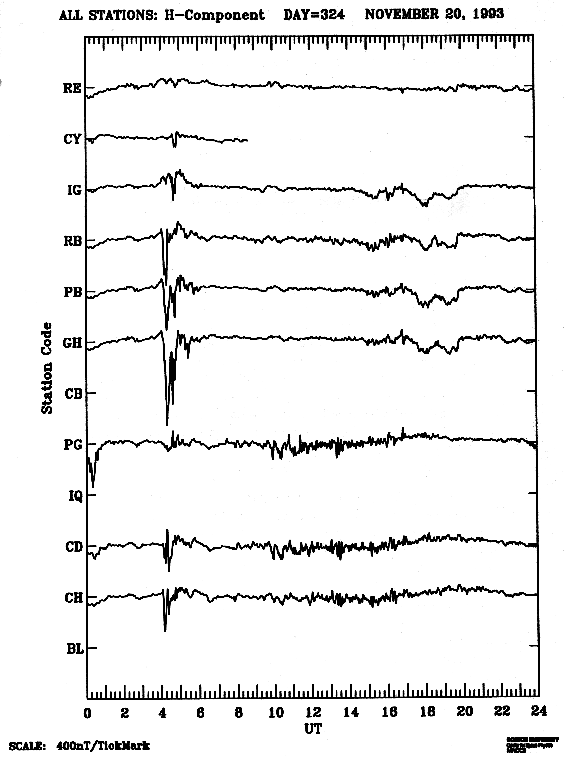
Separate data archives are maintained at both Boston University and Augsburg College. Three data sets are produced, high time resolution (0.5 or 1 sec), 5 sec averages, and 1 min averages. We intend to distribute the 5 sec and 1 min averages on CD-ROM. In addition three standard data products are produced, a daily stacked magnetogram for each component illustrated in Figure 2, and two spectrograms (0-100 mHz and 0-1 Hz) for each station.
Data requests may be submitted to either hughes@bu.edu or engebret@augsburg.edu.
4. Scientific Results
The primary purpose of the MACCS array is, in combination with data from other ground based and satellite instruments, to study the waves, currents and plasma flows associated with the cusp and to use these to infer what we can about the magnetopause and magnetospheric boundary layers, and the physical processes going on there. Figure 2 shows a typical daily H component magnetogram from MACCS. A clear substorm onset occurred at about 04 UT when local midnight was within the MACCS sector. Long period pulsations are observed later as the array moves around to the dayside and passes near the cusp. So far MACCS data has been used primarily to study traveling convection vortices, waves in the Pc 3-4 band, and waves in the Pc 1-2 band. In the future we expect to make use of MACCS data to study high latitude convection and the high latitude signatures of substorms. In this section we briefly describe some initial results from MACCS in order to illustrate the type of data available from MACCS, and refer the reader to more detailed papers.
Traveling Convection Vortices
Traveling convection vortices (TCVs) appear as a single pulse, a bipolar signature or a short train of oscillations in a high latitude magnetogram. They have a period of about 10 minutes and an amplitude of typically 100 nT. Friis-Christensen et al. [1988] showed that when the magnetic perturbations from a chain of stations are represented as ionospheric convection flow vectors, a vortical pattern results. These vortices move either east or west, almost always away from local noon, with a velocity of several kilometers per second. Initial statisical studies with MACCS have confirmed this result [Hughes et al., 1995]. Prior to work with MACCS, the principal data for the study of TCVs came from latitudinal chains of magnetometers. This made it difficult to follow the temporal development of TCVs as they move primarily east-west.
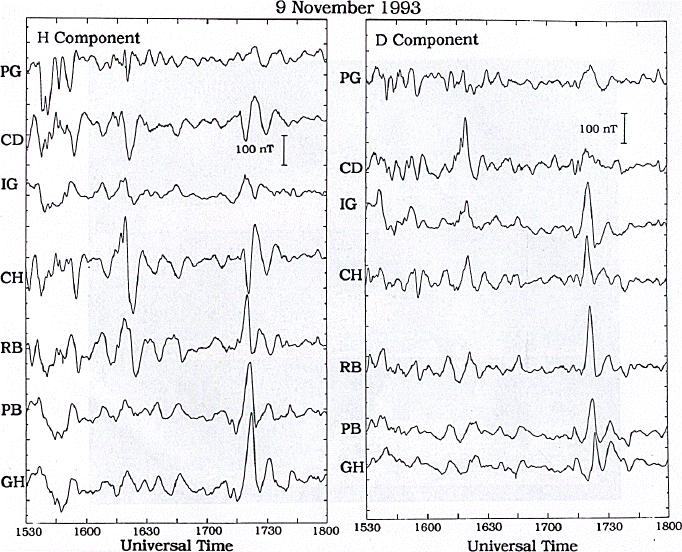
One of the initial results from MACCS is the observation of the rapid growth and decay of individual current filaments in a TCV event [Hughes, 1994; Hughes et al., 1995]. Figure 3 shows examples of TCVs observed by MACCS near local noon. Two TCV events occurred during this interval, at 1620 and 1720 UT. The second event caused a large pulse ( >100 nT) at all stations except PG, though the pulse shape and polarization varies across the array. In contrast, the event at 1620 UT exceeded 100 nT at only three stations near the center of the array (CD, CH, and RB). This latter observation shows that TCVs can be quite localized, and that their amplitude can decay significantly before they propagate very far.
Pc 3-4 Pulsations
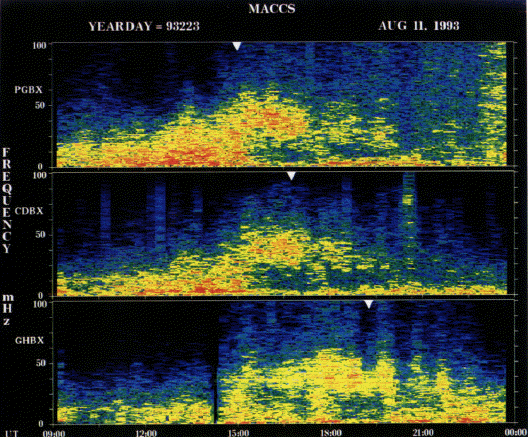
Figure 4 shows 1-100 mHz spectrograms from three MACCS stations (PG, CD and GH) that span 4 hours in MLT. These spectrograms show examples of the two common types of wave observed in the Pc 3-4 frequency band at high latitudes. The broad band power between 0 and 40 mHz seen in the top panel prior to 15 UT is Pi 1. The somewhat higher frequency, band limited waves, seen at both PG and CD from 15-17 UT are Pc 3. Pi 1 are incoherent over relatively short spatial scales, and are believed to be produced by temporal variations in the ionospheric conductivity brought about by precipitating particles. Pc 3 are relatively narrow band emissions with frequency around 30 mHz whose occurrence is well correlated with the so-called IMF cone angle [Engebretson et al., 1989].
Using MACCS data we have shown that the occurrences of both types of wave are well correlated over a wide area [Engebretson et al., 1995]. This can be seen in Figure 4. Although at each station the waves are seen more clearly within a few hours of local noon (marked by white triangles), at all three stations we see the same three gaps in the occurrence of the broad band Pi 1, 1300-1530, 1800-2000, and 2030-2130 UT. During these three intervals, narrow band Pc 3 is seen. This observation indicates that the incidence of these two types of wave is controlled temporally and not spatially, and that the presence or absence of these waves can not be used to indicate the location of a station relative to the cusp or boundary layer.
Pc 1-2 Emissions
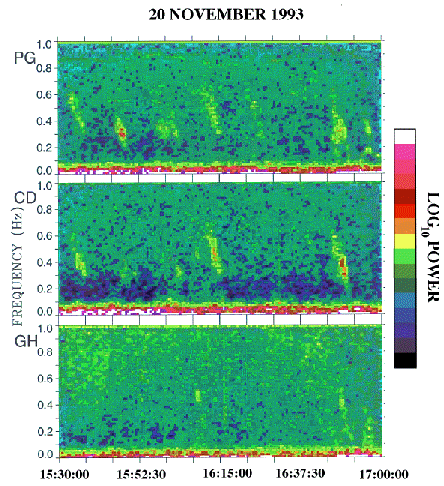
The sensitivity of the ring core flux gate design allows it to be used to study Pc 1-2 pulsations that cannot be seen in a conventional flux gate magnetometer. We illustrate that here by showing an example of the Pc 1-2 bursts associated with TCVs [Arnoldy et al., 1988]. Figure 5 shows 0-1 Hz spectrograms from three MACCS stations (PG, CD and RB) covering 90 minutes of the day illustrated in Figure 2. At PG and CD a series of at least 6 wave bursts occurs. The frequencies of several of the bursts drop rapidly from around 0.6 to 0.3 Hz. The bursts are associated with the TCVs and long period pulsations that can be seen in the Figure 2 magnetograms. At the most western site, GH, two weak bursts are observed. These are probably two of the same bursts that have propagateed in the ionospheric waveguide.
5. Collaborations
Although the operation of a magnetometer chain provides significant advantages over the study of data from an isolated station, coordination of magnetometer data with other data, either from other types of ground-based instrumentation or from satellites, is absolutely necessary to make the best use of the data. The full scientific potential of the MACCS array will only be realized if the data is used in collaboration with the many other solar-terrestrial data sets that will be gathered during the 1990s. It is our intention to make the data as freely available as possible, and to promote as many active collaborations as we can handle. We look forward in particular to collaborations with CLUSTER and other spacecraft investigators.
Acknowledgements: The operation of MACCS would not be possible without the assistance of the volunteer field operators who monitor and help maintain the equipment. We thank Richard Coles and Larry Newitt (Geological Survey of Canada) for their help and active collaboration. MACCS is supported by the GEM Program of the National Science Foundation by grants ATM9401733 (Boston University) and ATM9401524 (Augsburg College).
REFERENCES
Arnoldy, R. L., M. J. Engebretson, and L. J. Cahill, Bursts of Pc 1-2 near the ionospheric footprint of the cusp and their relationship to flux transfer events, Journal of Geophysical Research, 93, 1007, 1988.
Baker, K.B., and S. Wing, A new magnetic coordinate system for conjugate studies at high latitudes, Journal of Geophysical Research, 94, 9139, 1989.
Engebretson, M. J., B. J. Anderson, L. J. Cahill, Jr., R. L. Arnoldy, P. T. Newell, C. -I. Meng, L. J. Zanetti, and T. A. Potemra, A multipoint case study of high latitude daytime ULF pulsations, Journal of Geophysical Research, 94, 17143, 1989.
Engebretson, M.J., W.J. Hughes, J.L. Alford, E. Zesta, L.J. Cahill, Jr., R.L. Arnoldy, and G.D. Reeves, MACCS Observations of the Spatial Extent of Broadband ULF Magnetic Pulsations at Cusp/Cleft Latitudes, Journal of Geophysical Research, 100, 19371, 1995.
Friis-Christensen, E., M.A. McHenry, C.R. Clauer, and S. Vennerstrom, Ionospheric traveling convection vortices observed near the polar cleft: A triggered response to sudden changes in the solar wind, Journal of Geophysical Research Lett. 15, 253, 1988.
Hughes, W.J., ULF Waves in the cusp and cleft: Signatures of boundary layer processes, in Physical Signatures of Magnetospheric Boundary Layer Processes, edited by A. Egeland, J. Holtet, and P.E. Sandholt, Dordrecht: Kulwer Academic Publishers, 1994.
Hughes, W.J., M.J. Engebretson, and E. Zesta, Ground Observations of Transient Cusp Phenomena: Initial Results from MACCS, Physics of the Magnetopause, (P. Song, B.U.O. Sonnerup, and M.F. Thomsen, eds.) AGU Geophys. Mono. Ser., v90, p.427, Am. Geophys. Un., Washington DC, 1995.
| TABLE
1: The Coordinates of the MACCS Magnetometer Sites. | |||||||
|---|---|---|---|---|---|---|---|
| Abbrev. | Station Name | Geog. Lat. |
Geog. Long. |
PACE Lat. |
PACE Long. |
UT of noon MLT |
Data Begins |
| PG | Pangnirtung | 66.1 | 294.2 | 75.2 | +19.7 | 15:00 | Sept'92 |
| IQ | Iqaluit | 63.8 | 291.4 | 73.5 | +14.2 | 15:45 | Aug'95 |
| CD | Cape Dorset | 64.2 | 283.4 | 74.6 | +0.6 | 16:45 | Sept'92 |
| CH | Coral Harbour | 64.1 | 276.8 | 74.7 | -11.2 | 17:30 | Oct '93 |
| BK | Baker Lake | 64.3 | 264.0 | 74.3 | -34.2 | 19:05 | Aug '95 |
| CY | Clyde | 70.5 | 291.4 | 79.7 | +18.6 | 15:30 | Sept'93 |
| IG | Igloolik | 69.3 | 278.2 | 79.5 | -8.7 | 17:20 | Sept'93 |
| RB | Repulse Bay | 66.5 | 273.8 | 76.9 | -17.2 | 17:55 | Sept'92 |
| PB | Pelly Bay | 68.5 | 270.3 | 78.7 | -25.0 | 18:25 | Sept'93 |
| GH | Gjoa Haven | 68.6 | 264.1 | 78.3 | -37.0 | 19:15 | Sept'93 |
| CB | Cambridge Bay | 69.1 | 254.9 | 77.5 | -53.8 | 20:25 | Oct '94 |
| RE | Resolute Bay | 74.7 | 265.2 | 83.7 | -44.2 | 19:45 | Oct '93 |
[Back to 2. Location] [Back to 3. Operations]
FIGURE CAPTIONS
Figure 1. A map of northeastern Canada showing the MACCS sites and the magnetic observatories at Resolute, Cambridge Bay, Baker Lake and Iqaluit (solid circles, station identifiers are listed in Table 1). CANOPUS (open triangles) and Greenland West Coast Chain (open diamonds) magnetometer sites are also marked. The heavy lines show PACE Corrected Geomagnetic Latitude.
Figure 2. Typical stacked H component 24-hour magnetograms from MACCS. Although MACCS spans almost 6 hours in MLT, broadly speaking the array is on the nightside for 0-12 UT and on the dayside for 12-14 UT. Stations are ordered with Resolute at the top, then the northern tier of stations from east to west, followed by the southern tier. This day illustrates typical substorm activity on the nightside and the long period pulsations typical of the high latitude dayside and cusp regions.
Figure 3. Two TCV events observed by MACCS. The TCV at 1620 UT exceeds 100 nT at only three stations near the middle of the array, CD, CH, and RB, showing that it is quite localized. The TCV at 1720 UT was more wide spread and exceeded 100 nT at all stations except PG.
Figure 4. A magnetic field spectrogram showing power in the 0-100 mHz band at PG, CD and GH, over a 15 hour interval. Local noon is indicated by a white triangle at the top of each panel. Both Pi 1 (broad band) and Pc 3 (narrow band) occurrence patterns are very similar at the three sites although they cover over 3 hours in local time. However, at each site the waves are most intense near local noon.
Figure 5. A magnetic field spectrogram showing power in the 0-1 Hz band at PG, CD and GH. At least six separate bursts of Pc 1-2 emissions occur during this 90 minute period, several with sharply falling tones. These bursts are associated with the TCVs and long period pulsations seen in Figure 2.
Reference for this paper:
Hughes, W.J., and M.J. Engebretson
MACCS: Magnetometer array for cusp and cleft studies, in the Satellite
- Ground Based Coordination Sourcebook, ESA-SP-1198, edited by M. Lockwood,
M.N. Wild, and H.J. Opgenoorth, European Space Agency Publication, ESTEC, Noordwijk,
The Netherlands, p. 119, 1997.